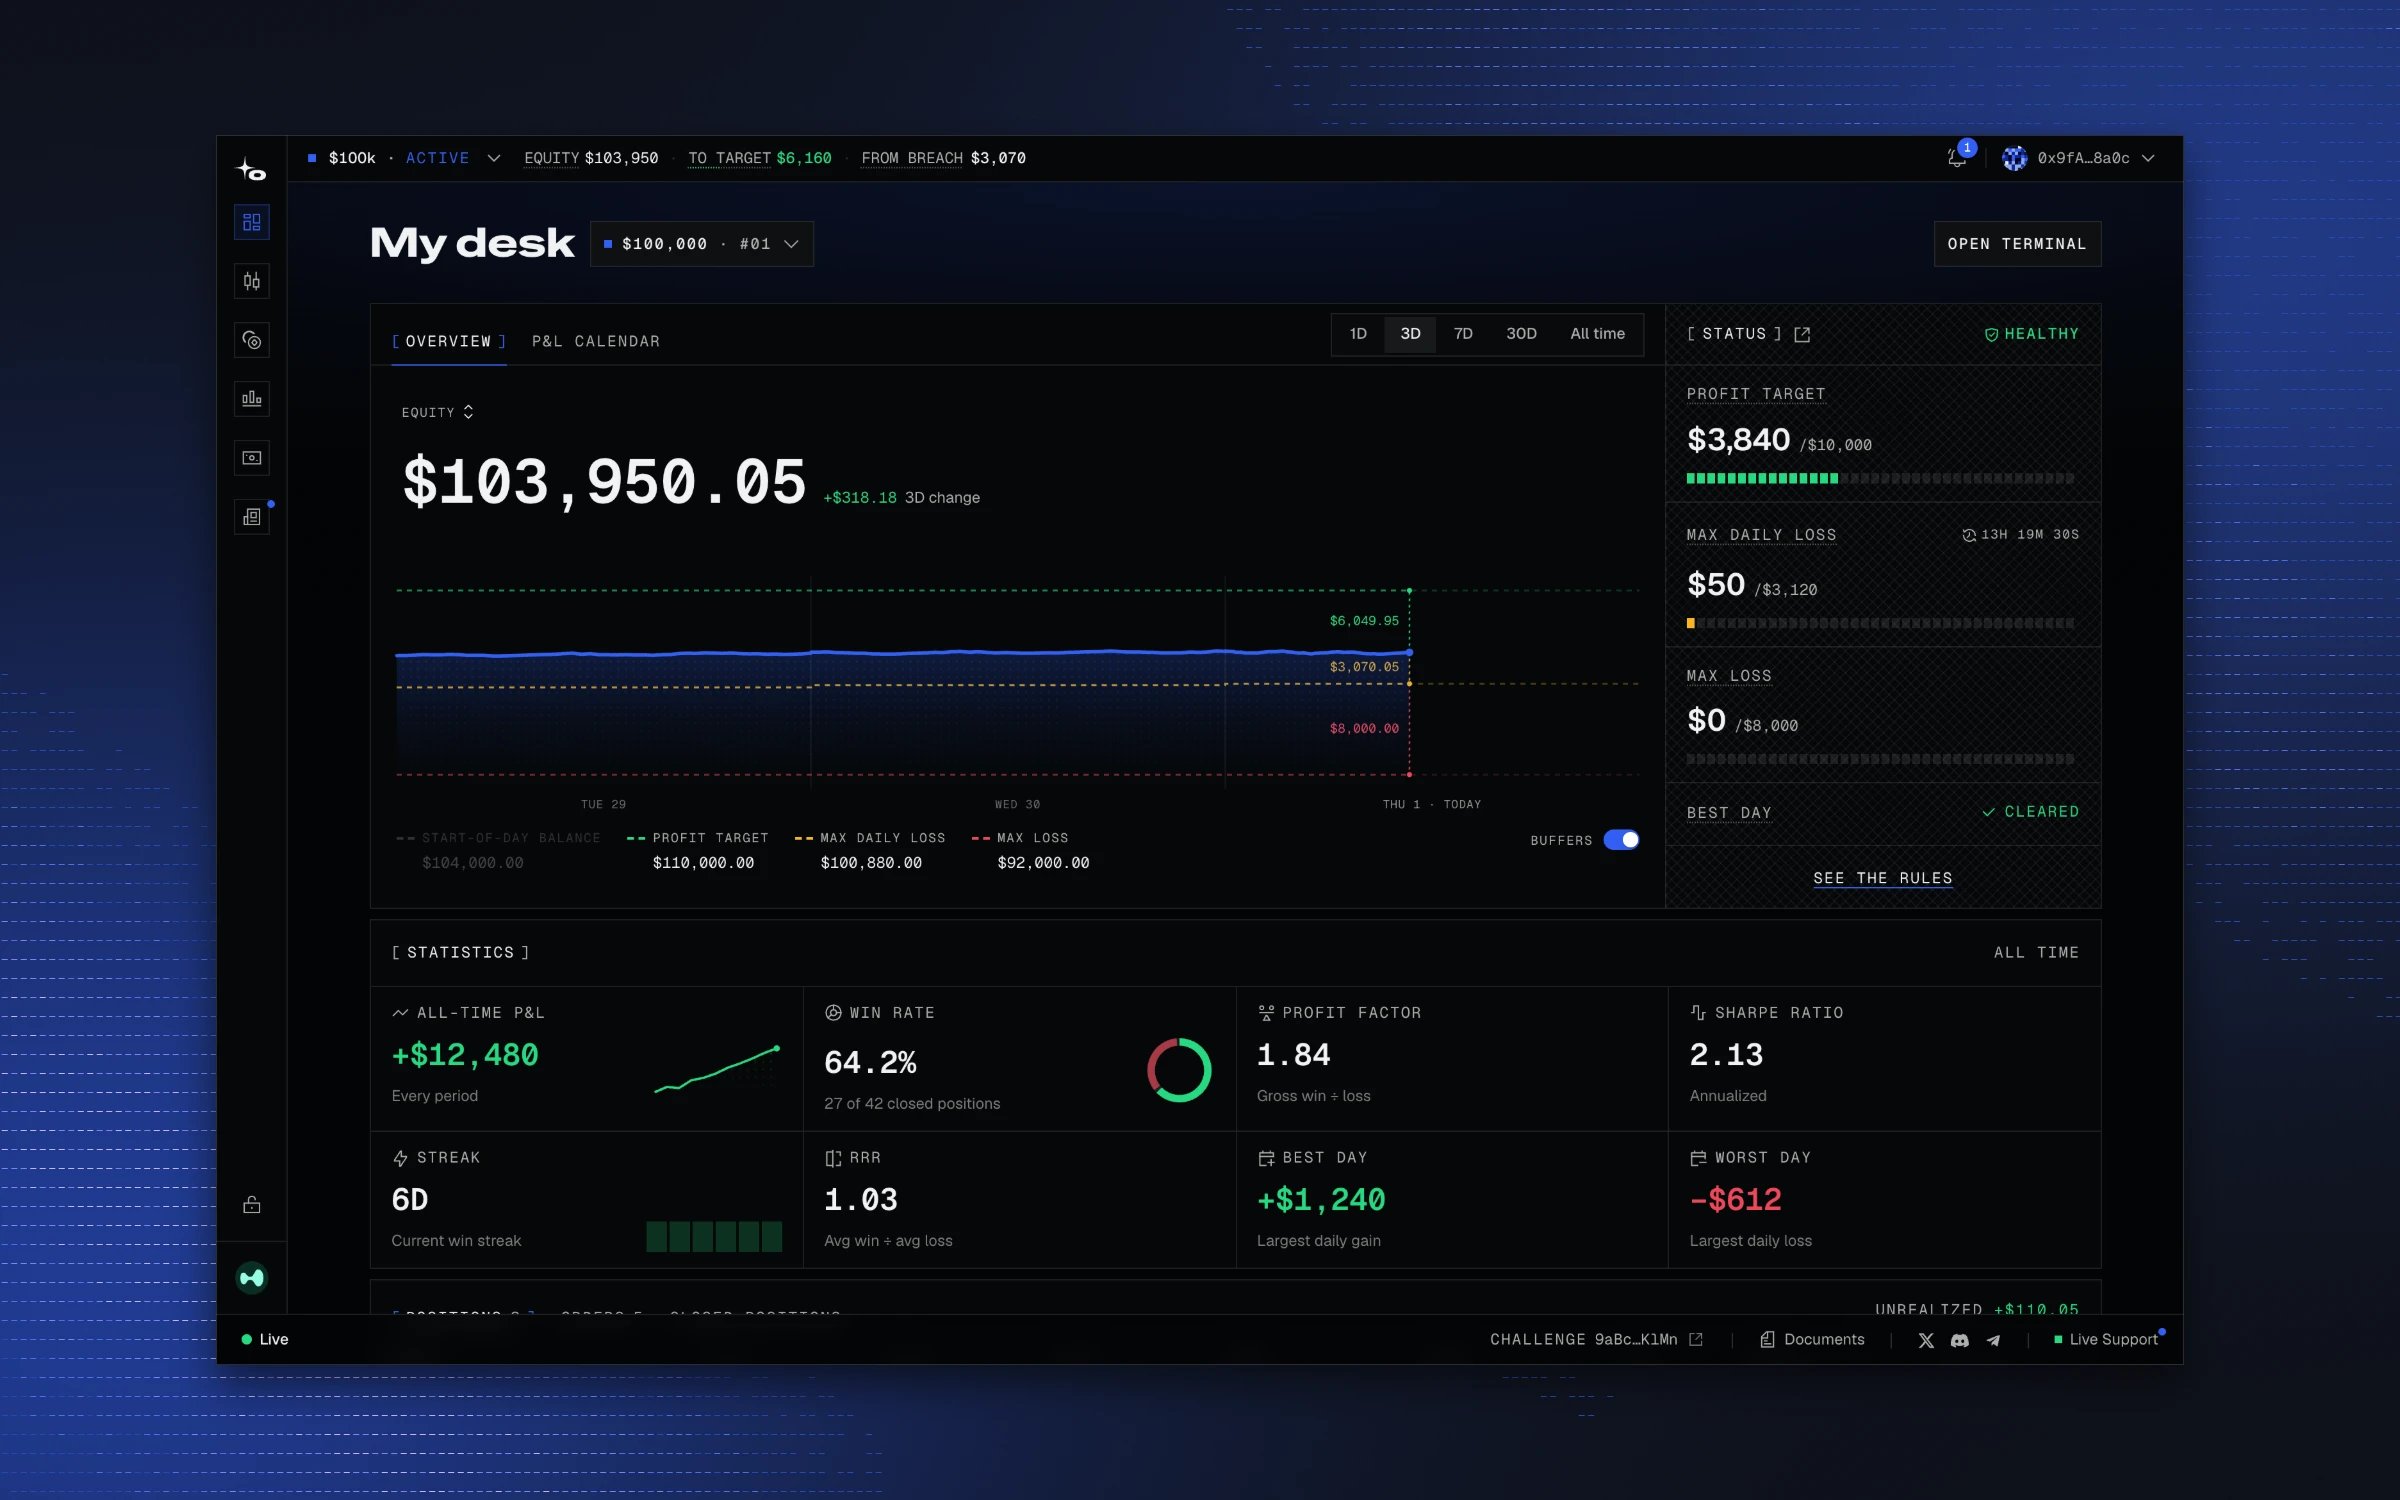
The Desk shows how the selected account has performed. Trading happens in the trading terminal; the Desk gives you a visual of your performance and statistics.
OWNIT My desk for a healthy $100k evaluation: equity chart with the target and breach lines, status meters for profit target, max daily loss, and max loss, and statistics.

What you can see

  • Current equity: equity over time, with selectable ranges.
  • P&L calendar: daily P&L by calendar day.
  • Status: the rule meters and the account’s phase: evaluation, funded, or breached.
  • Statistics: all-time P&L, win rate, profit factor, Sharpe ratio, streak, risk-reward ratio, best day, worst day.
  • Positions and orders: open positions and working orders, same as the trading screen.
Best day here refers to the Best day rule progress; for more info, see the Rulebook.

What the Desk is for

The Desk is for review, not execution: how equity is developing, how consistent results are, and what is open right now. During an evaluation it is also the account’s progress record.