Customize the chart
Indicators
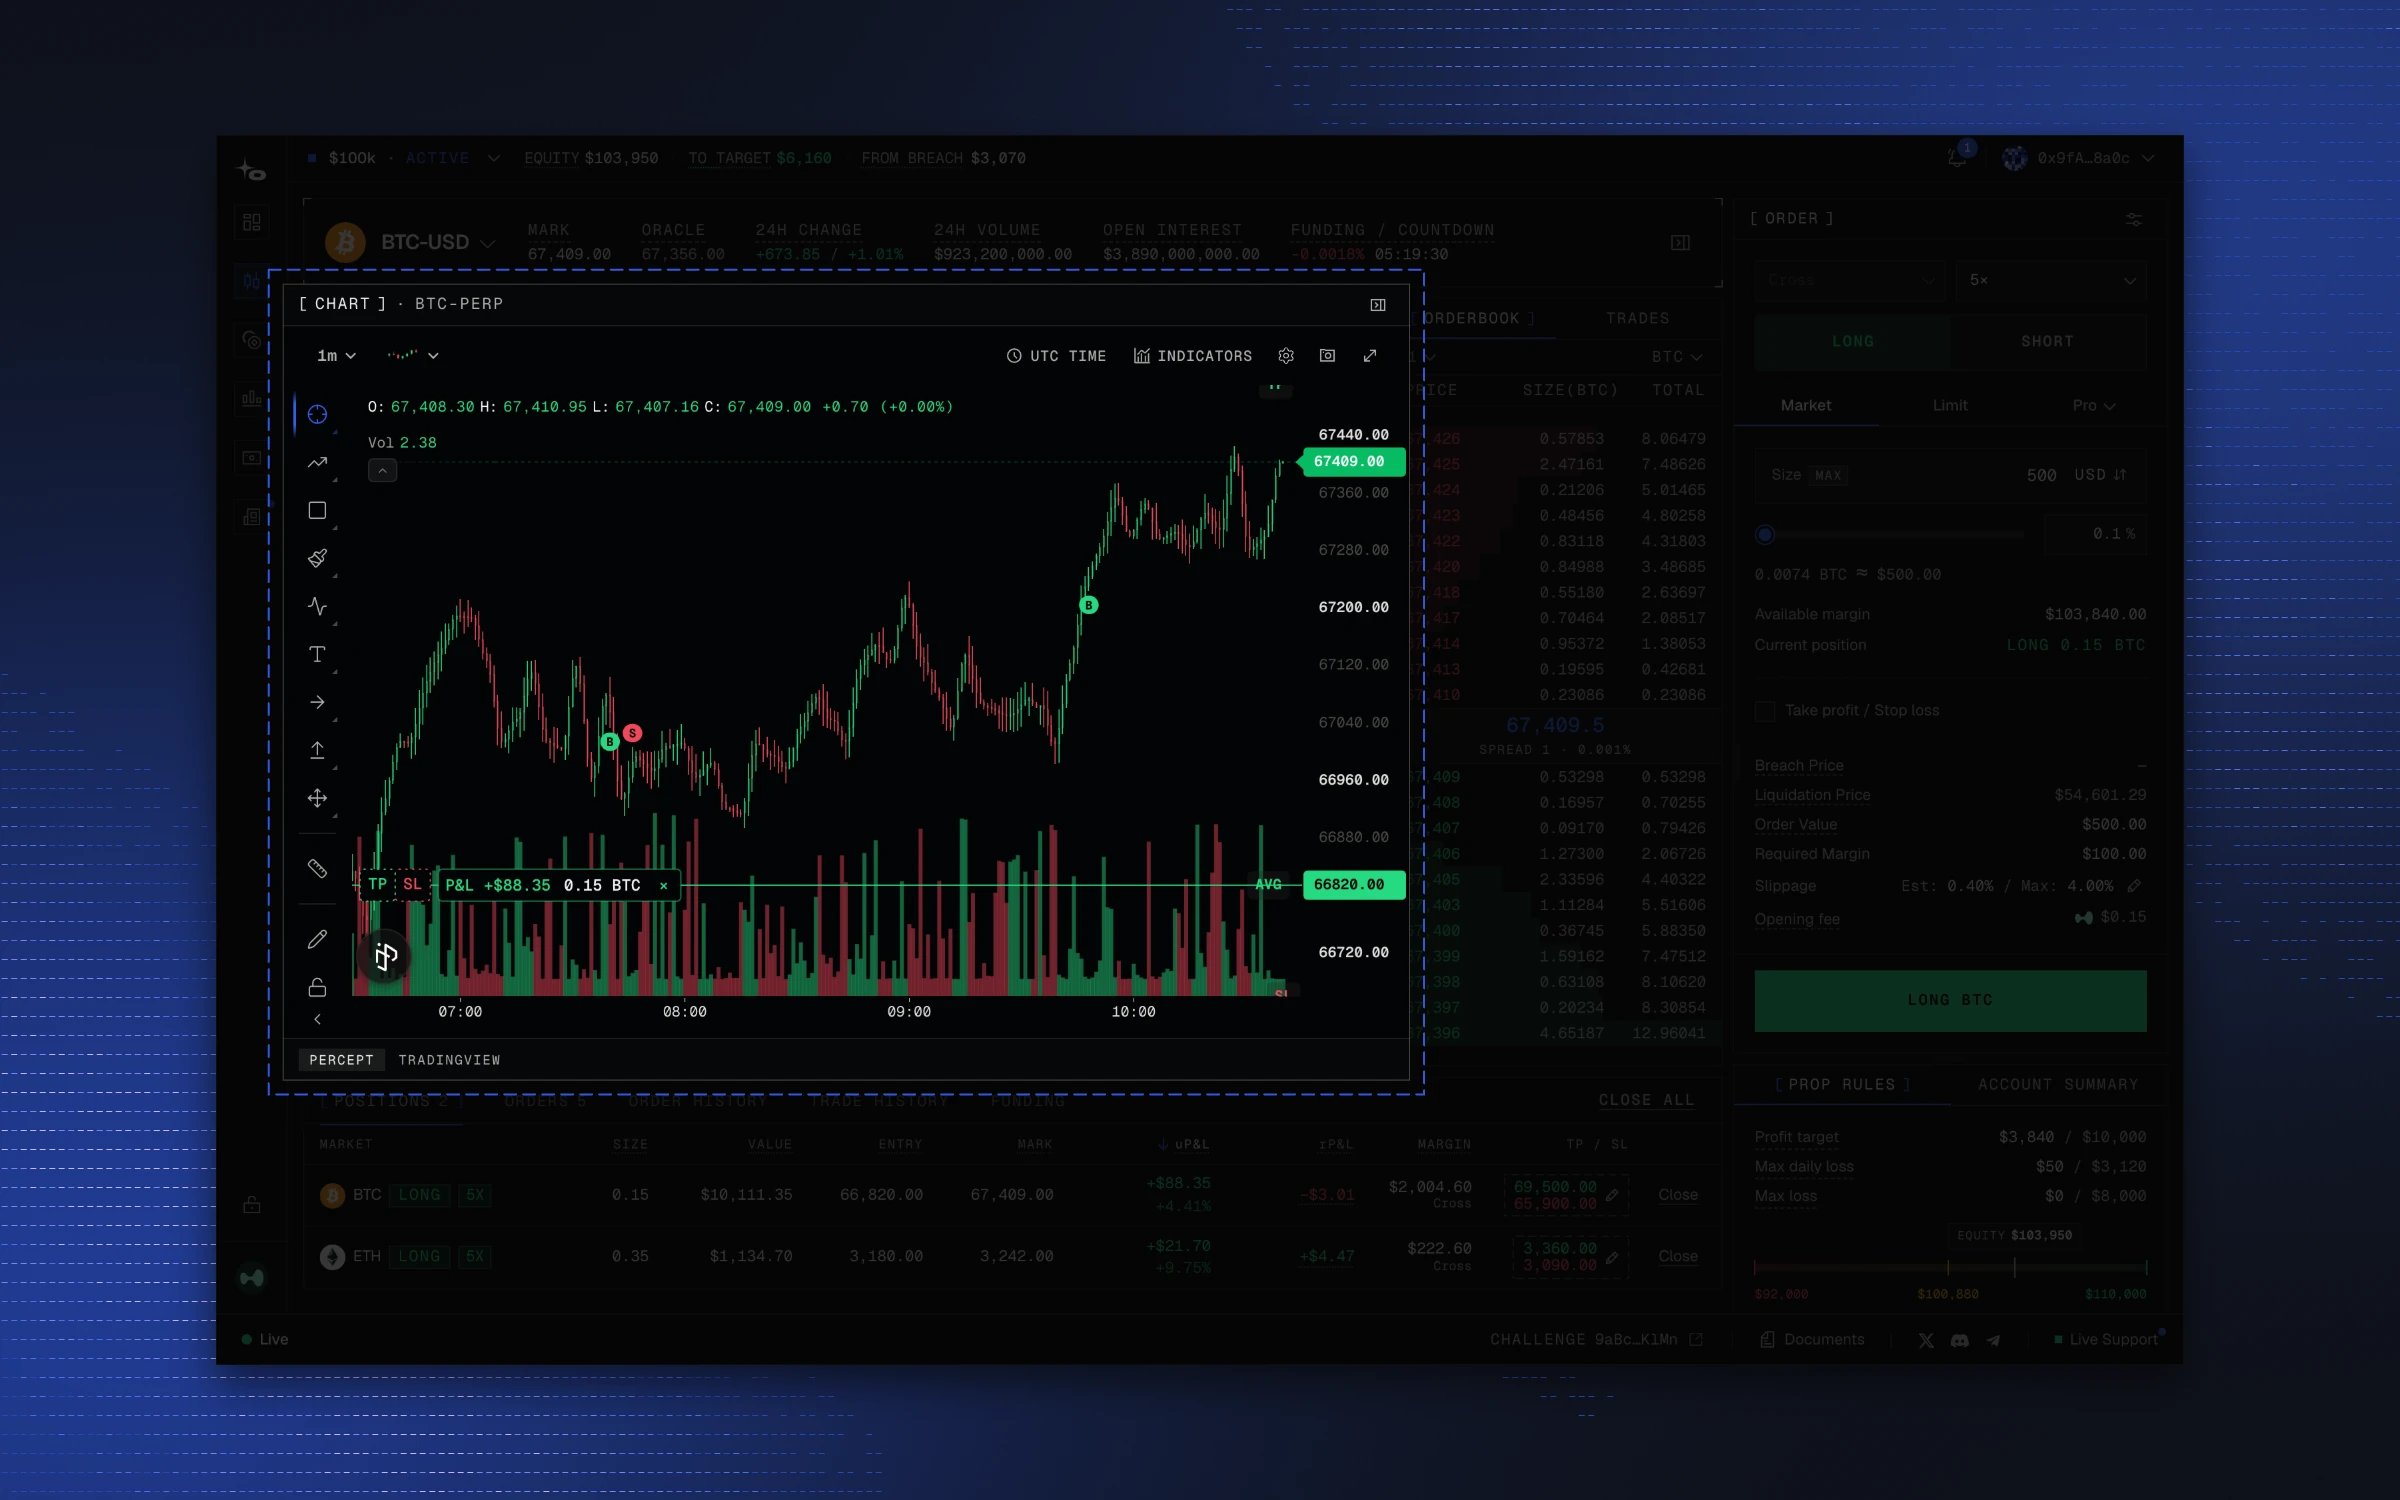
Select Indicators and search by name. Any number can be active at once.- Trend and momentum: SMA, EMA, RSI, Bollinger Bands, MACD, CCI, MFI, Stochastic Oscillator, ADX, Parabolic SAR, Ichimoku Cloud
- Volume and order flow: OBV, Accumulation Distribution Line, Cumulative Volume Delta, Volume Footprint, off-chart Volume
- Derivatives data: Open Interest, Funding Rate, Liquidations
- Market profiles: Session Volume Profile, Visible Range Volume Profile, Time Price Opportunity
- Liquidity tools: Order Book Heatmap, Hyperliquid Liquidation Heatmap, TP/SL Heatmap
- Cross-market: Compare Symbol, Arbitrage Spread
Drawing tools
Drawing controls: Stay in Drawing Mode, Lock, Hide, Delete. Chart snapshot saves the current view with its drawings.
Interface appearance
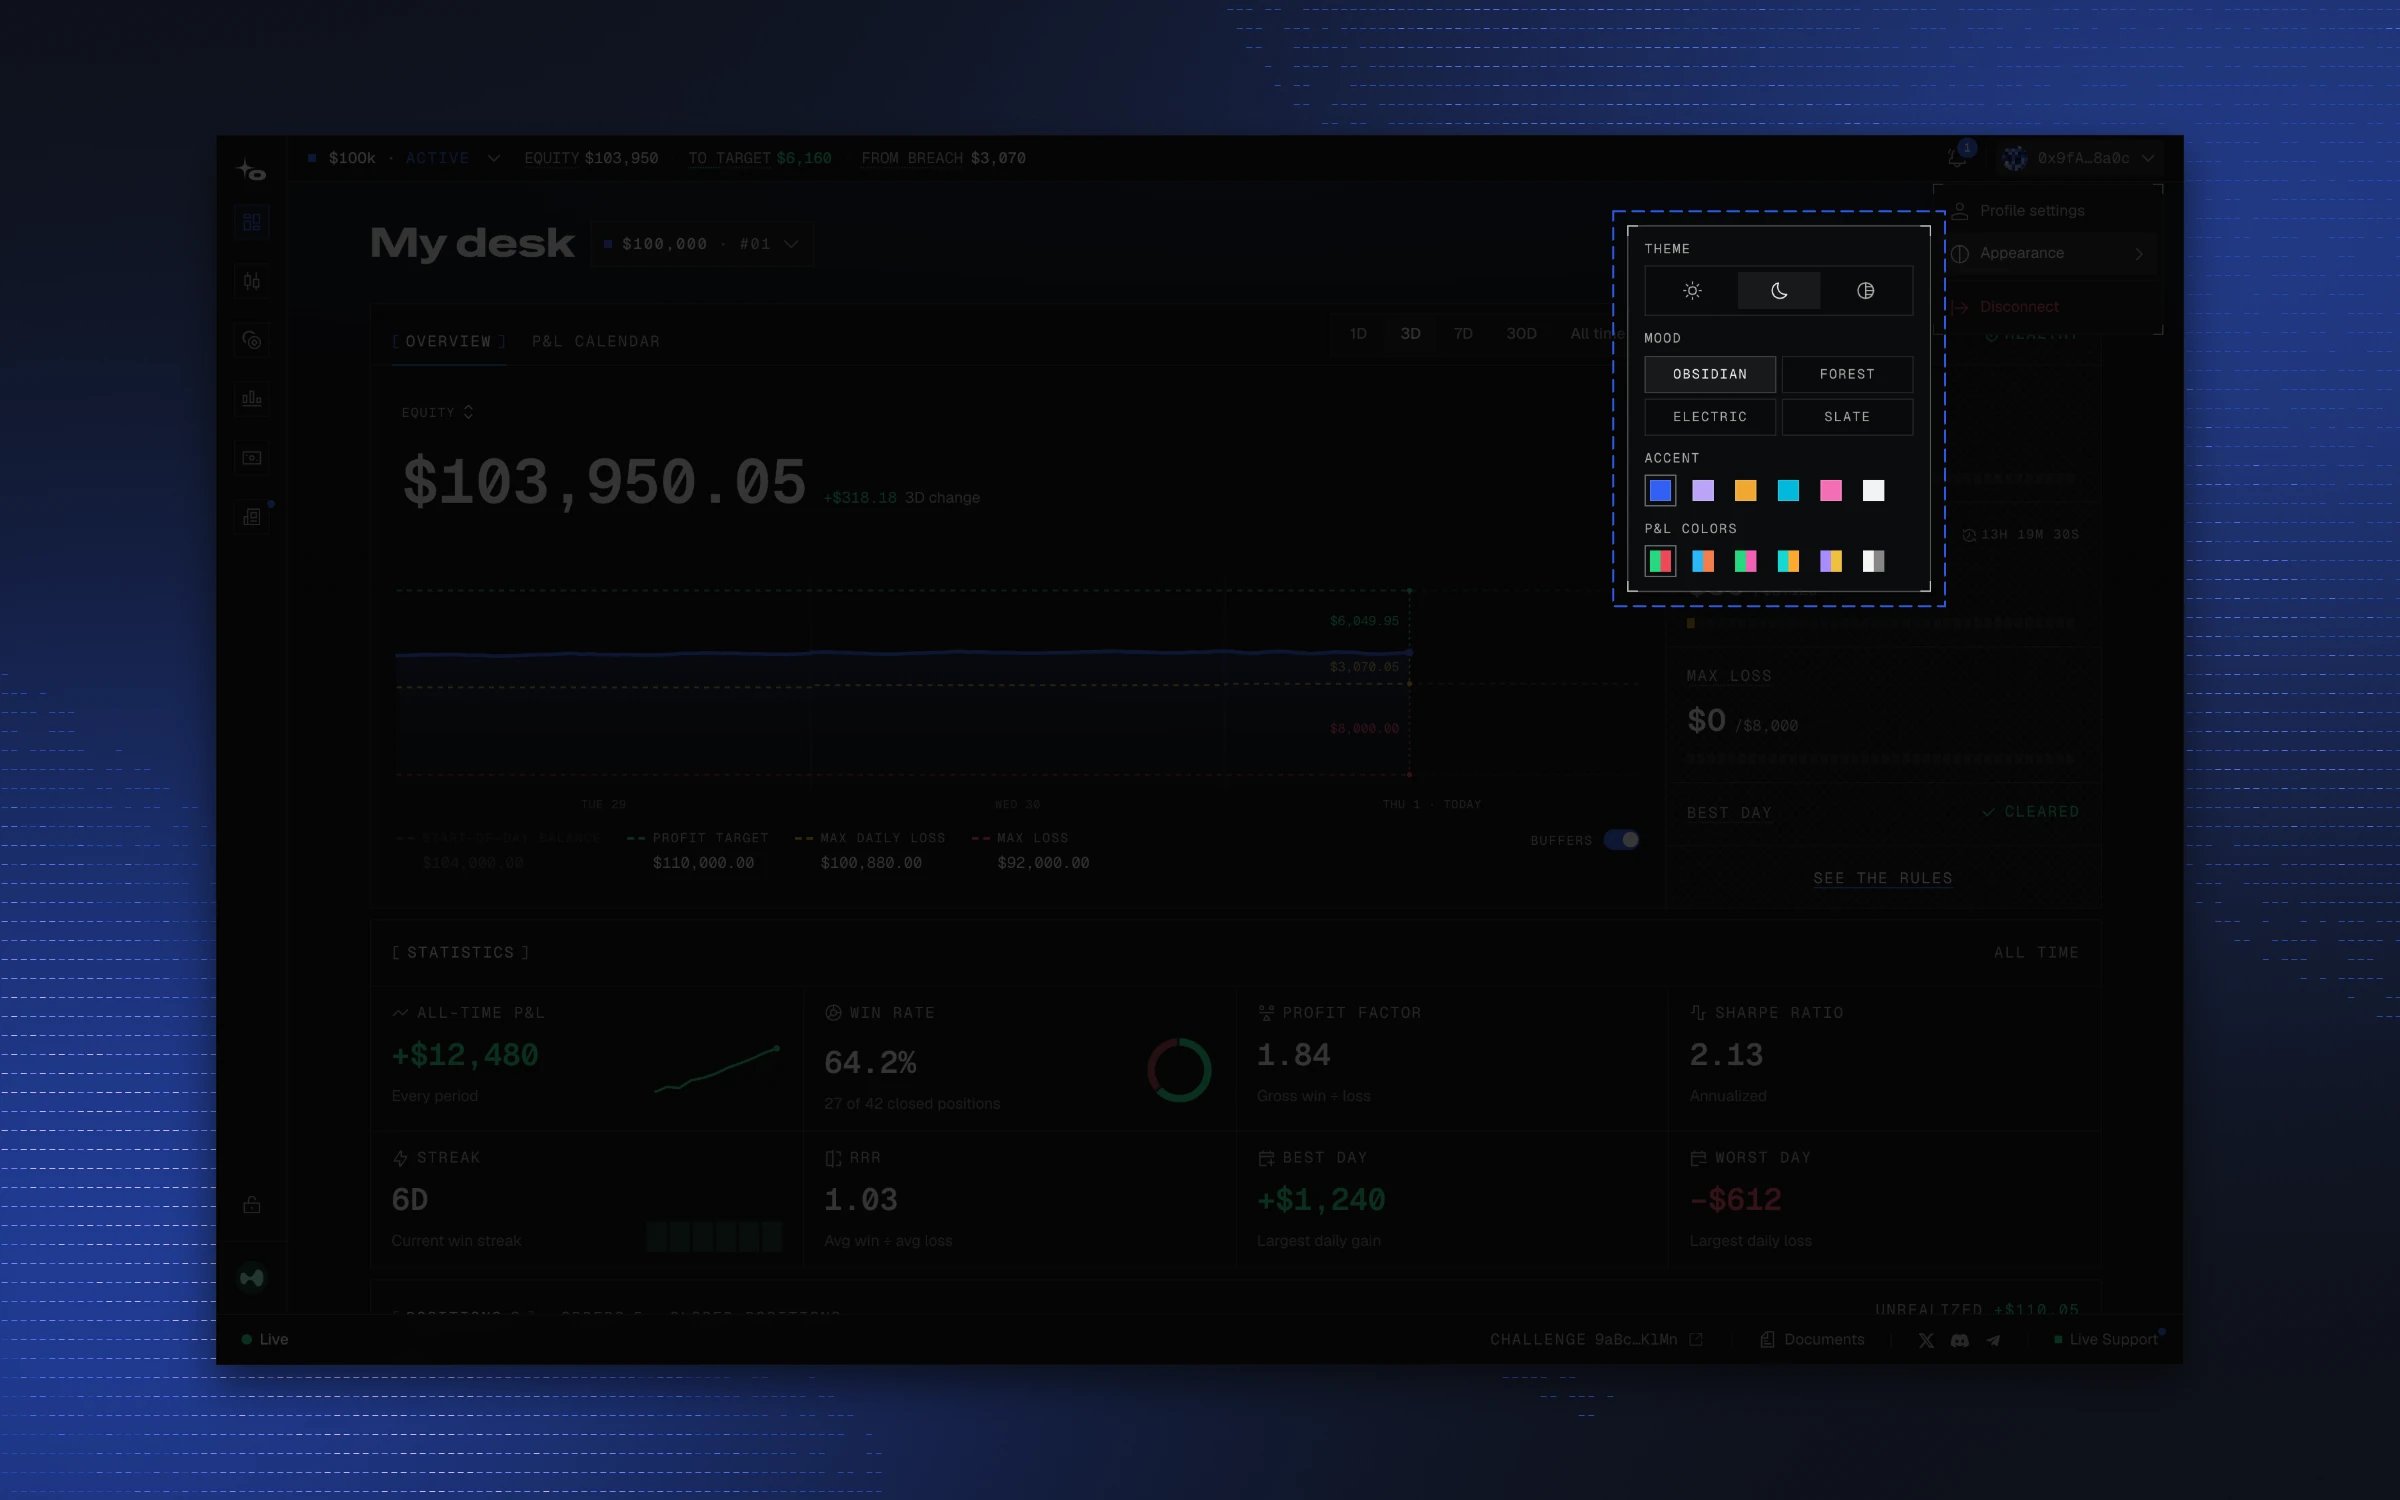
Theme, mood, accent color, P&L colors, and font size apply to the whole trading screen, not just the chart. They are set under Appearance.Open Appearance settings
- Click your Account in the top-right corner of the trading screen.
- Select Appearance.
- Pick the settings you want.